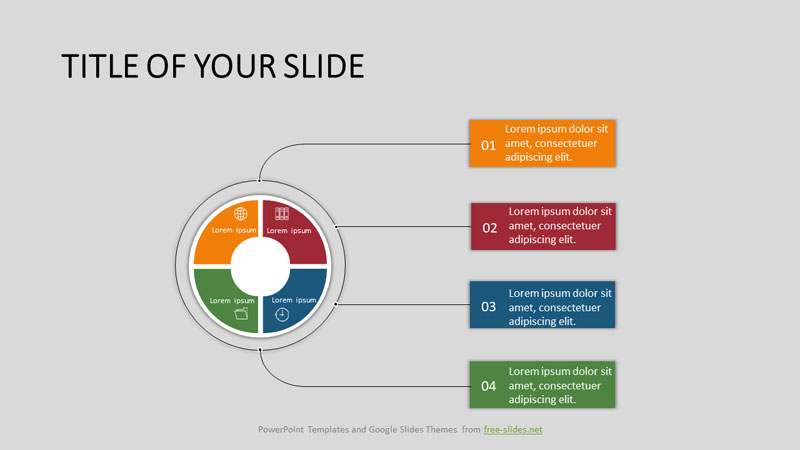
The pie chart is divided into four equal sectors. Each of the sectors has its own color and icon.
A callout with a text block departs from each sector. Each of the callouts has the color of the sector it comes from.
The proposed graphic elements can be used to demonstrate the properties and characteristics of different parts of the same object.
Pie Chart With Rectangular Callouts Infographic Template Features
- Upon implementation, the elements are easily adapted to the used color scheme;
- There are 3 demonstration slides with white, gray and black layouts;
- Fully editable objects: text, shapes;
- Widescreen format (16: 9);
- Compatible with Microsoft PowerPoint and Google Slides;
- This template is fully ready for use. Just insert it into your presentation and edit the texts.
Infographic template in Google Slides: