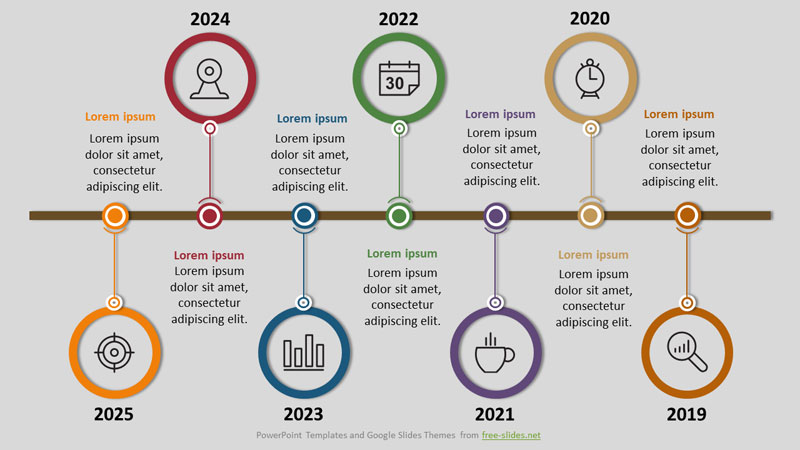
Infographics for visualizing time intervals. Consists of circles with icons and dates along a horizontal line.
You can use this infographic in presentations where you need to show the dynamics of changes over the years, stages of development, formation.
Infographic Template Features
- Upon implementation, the elements are easily adapted to the used color scheme;
- There are 3 demonstration slides with white, gray and black layouts;
- Fully editable objects: text, shapes;
- Widescreen format (16: 9);
- Compatible with Microsoft PowerPoint and Google Slides;
- This template is fully ready for use. Just insert it into your presentation and edit the texts.
Infographic Template in Google Slides:

