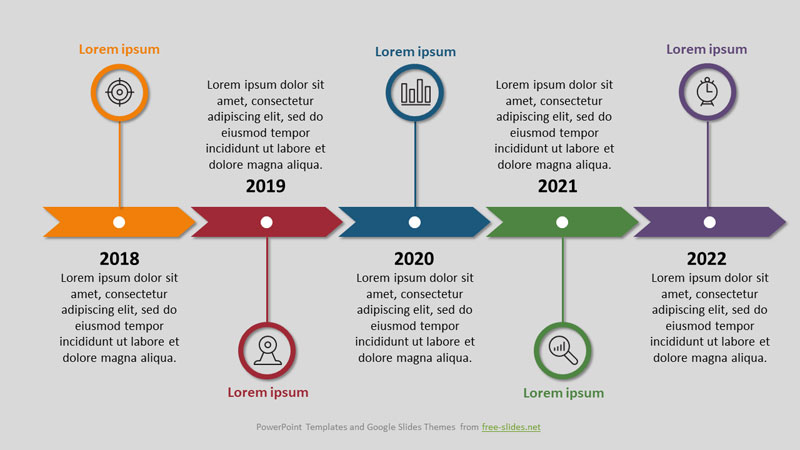
Infographics to represent processes, events in time. Consists of circles with icons and years along horizontal sequential arrows.
You can use this infographic where you need to show the dynamics of changes over a certain period of time.
Infographic Template Features
- Upon implementation, the elements are easily adapted to the used color scheme;
- There are 3 demonstration slides with white, gray and black layouts;
- Fully editable objects: text, shapes;
- Widescreen format (16: 9);
- Compatible with Microsoft PowerPoint and Google Slides;
- This template is fully ready for use. Just insert it into your presentation and edit the texts.
Infographic Template in Google Slides:

